One of the most commonly used tools in technical analysis is candlestick patterns. These patterns allow traders to read and analyze market sentiments quickly. Candlestick patterns are nothing but human psychology behind price movements. These patterns form through the open, high, low, and close prices within a specific time frame. You can spot momentum shifts, trend reversals, or breakout signals just by looking at them. In this blog, we will take a look at the top 12 candlestick patterns that traders use the most. But before that, a little bit of history.
History of Candlestick Patterns
Candlestick charting began in 18th-century Japan. A rice trader named Munehisa Homma noticed recurring price behaviors. He began recording them using visual bars. And that’s what we call candlesticks today. The system evolved gradually and later, Western traders adopted this method in 1990s to analyze the market. Today, almost every technical analyst and trader relies on candlesticks while building their trading setups.
Why Candlestick Patterns?
Candlestick patterns are quite popular and the reason is, they are quite easy to use. Each candle shows the price movement within a a specific time frame, i.e, hour, minute, day or week. It’s got a wick or wicks (on top and bottom) and body. Traders use these patterns to spot early signs of market strength or weakness. A bullish pattern might indicate potential upward movement.
A bearish one might warn of a reversal. These patterns often appear at critical price points. So traders can fuse multiple other tools, along with candlesticks to identify entry or exits.
Now let’s take a look at top 12 candlestick patterns that traders use.
Top 12 Candlestick Patterns Every Trader Should Know
- Bullish Engulfing
This pattern shows up during a downtrend and signals a reversal. A small red candle gets followed by a much larger green candle that “engulfs” the previous one. This shift suggests buyers have overpowered sellers. When volume supports it, traders often take this as a strong buy signal. The larger the engulfing candle, the stronger the momentum. Spotting it near a key support level adds credibility. Momentum traders, especially those watching 1-hour or daily charts, use it to catch trend reversals early. This pattern doesn’t need confirmation, but we are waiting for strong, close help.
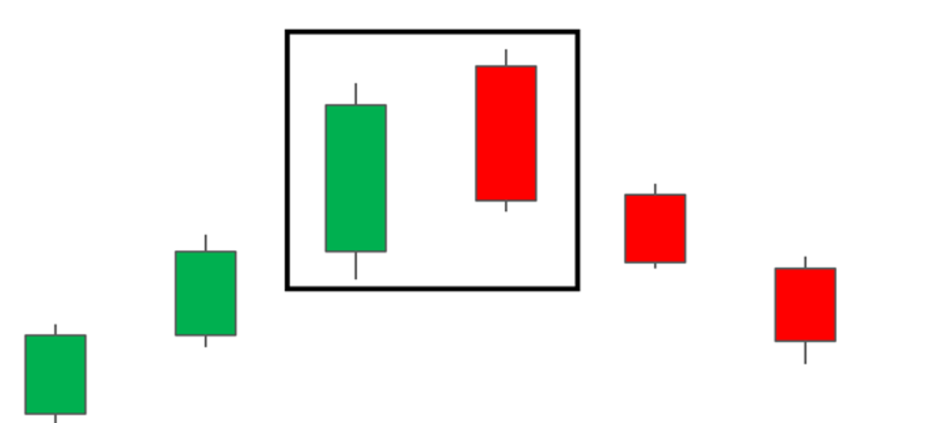
- Bearish Engulfing
This one appears at the top of an uptrend. A green candle is followed by a large red candle that completely covers it. That visual shift shows aggressive selling pressure. It hints at an exhausted rally and possibly a trend reversal. Traders watch this closely near resistance zones. It works best when the second candle forms with high volume. Swing and positional traders rely on this pattern to short or exit long positions. You must combine it with other indicators for better confirmation. A single candlestick won’t replace a full strategy—but it helps filter decisions fast.
- Doji
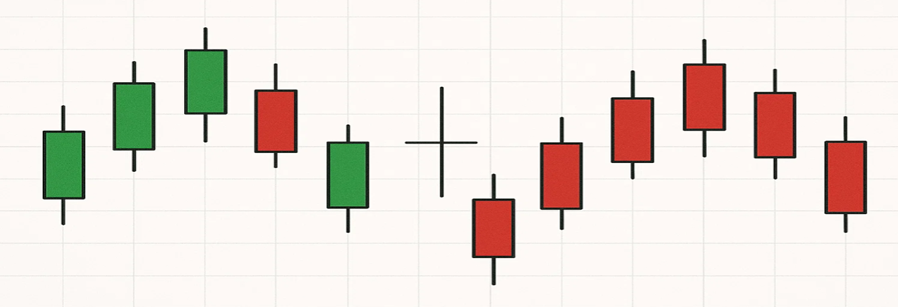
A Doji forms when the open and close prices are almost equal. The candle looks like a cross, suggesting indecision. Buyers and sellers fought hard but ended in a draw. You’ll often find these near-trend tops or bottoms. Alone, it doesn’t guarantee reversal—but in context, it adds weight. For example, after a strong rally, a Doji might show fading buying power. Traders combine it with volume analysis and RSI divergence. There are variants like Dragonfly Doji and Gravestone Doji, each with slight differences. The message stays the same—pause, observe, and be ready for a shift.
- Hammer
This bullish pattern appears after a downtrend. It has a small body at the top and a long lower wick. That wick shows sellers pushed prices down, but buyers fought back strongly. The result? A close near the top of the candle. This behavior often signals the end of selling pressure. Traders love spotting it near support levels. It becomes more powerful if followed by a green candle the next day. Hammers work on all timeframes, but daily charts offer more reliability. Use it with MACD or trendline support to boost accuracy.
- Shooting Star
This bearish pattern forms after a price rally. It looks like an upside-down hammer. The candle has a small body near the bottom and a long upper shadow. It shows buyers tried to push higher, but sellers took control. If this appears near resistance, it’s a warning. You’ll often see this pattern with a low volume on the green candle before it and a high volume on the red candle after it. That’s your cue. Traders use it to secure profits or open short positions. Just don’t rely on it in isolation—check momentum indicators, too.
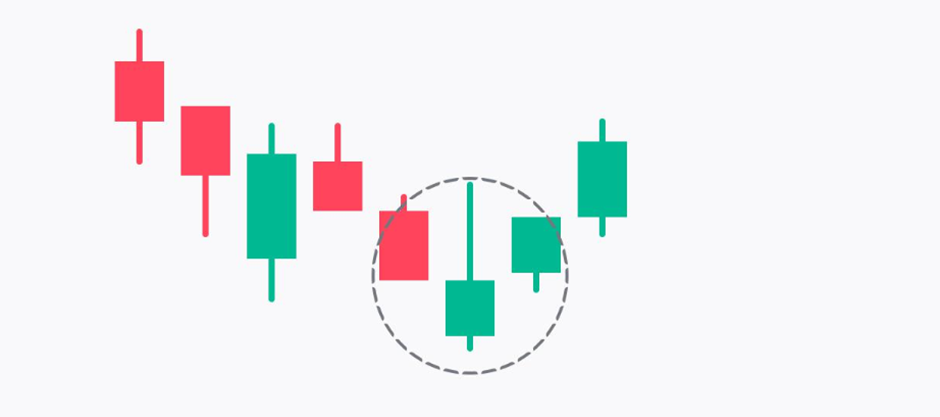
- Morning Star
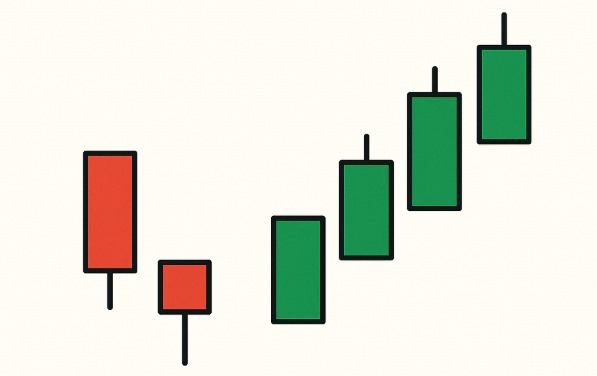
This pattern signals a potential bullish reversal after a downtrend. It’s a three-candle formation—first, a long red candle shows selling pressure. Second, a small-bodied candle (red or green) reflects indecision. Third, a large green candle confirms buying strength. The pattern works best near support levels with rising volume. Traders view this as a shift in momentum. It tells you that bears are losing control. Swing traders often enter long positions after the third candle closes. It’s more reliable on daily charts than intraday. Combine it with MACD or RSI for added confirmation. Watch for gaps between candles to increase impact.
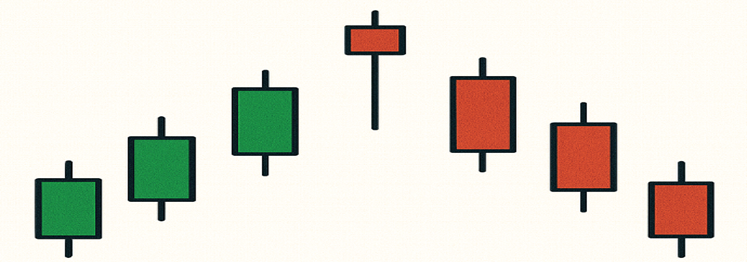
- Evening Star
The Evening Star is a bearish reversal pattern at the top of an uptrend. It also consists of three candles. The first one is a big green candle showing bullish momentum. The second is a small-bodied candle, indicating market hesitation. The third candle is a large red one, confirming that bears have taken over. This structure tells traders that buyers are exhausted. Spotting this near a resistance zone with high volume strengthens its signal. Day traders and swing traders use it to exit long positions or start short trades. You should validate this with trendlines and momentum indicators before acting.
- Inverted Hammer
This pattern appears at the bottom of a downtrend. It looks like an upside-down hammer, with a small body and a long upper shadow. It shows that buyers tried to push prices up, but sellers resisted. Still, the candle closing near its open hints at weakening selling pressure. Traders see this as a potential reversal sign. It becomes more significant when followed by a bullish candle. Use volume as a filter—higher volume makes the signal stronger. This pattern works better in daily and weekly timeframes. Many traders pair it with Fibonacci levels or trend channel analysis for confirmation.
- Hanging Man
The Hanging Man shows up at the top of an uptrend. It has a small body and a long lower shadow. It looks like a hammer but signals the opposite. This candle tells you that sellers entered the market aggressively. Although bulls managed to push back and close near the top, the pressure is clearly shifting. It’s a warning that buyers might lose control soon. Traders often wait for a red candle on the next day to confirm this pattern. It becomes more effective near resistance or round-number levels. Always consider volume spikes for higher reliability before placing your trade.
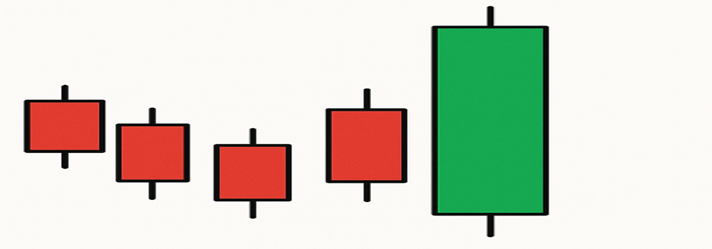
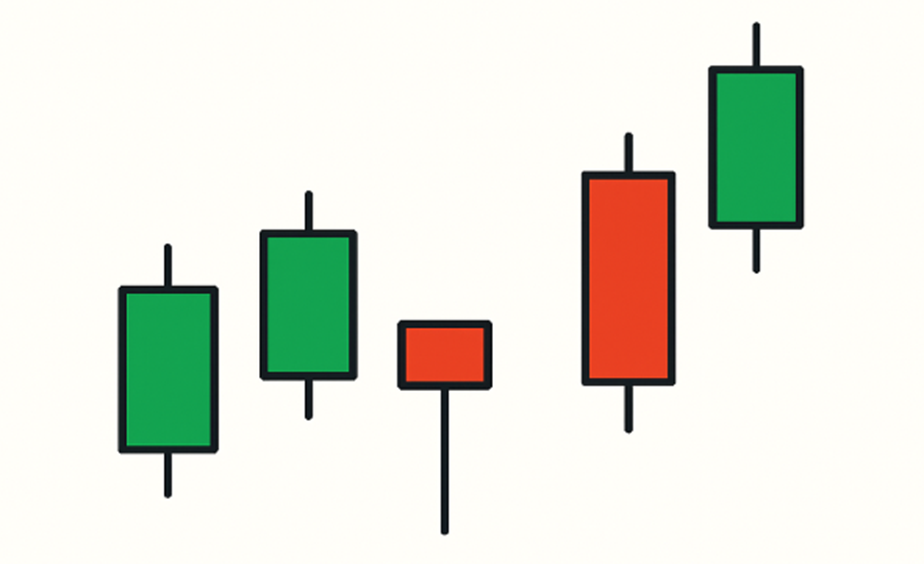
- Three White Soldiers
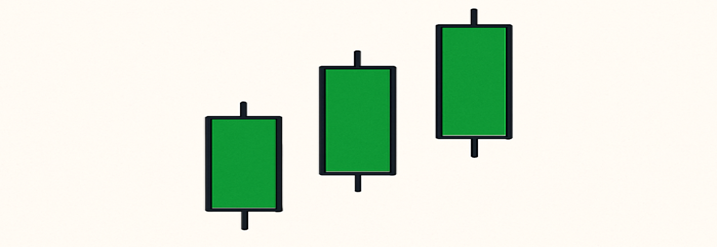
This pattern shows strong bullish sentiment and often signals a trend reversal or continuation. It consists of three consecutive green candles. Each candle opens within the previous body and closes higher. This shows consistent buying pressure. Traders treat it as a signal to enter long positions, especially after a prolonged downtrend. The pattern gains strength with high volume and when formed near key support zones. Long shadows should be minimal—too many wicks mean indecision. Use this alongside moving averages or trendlines for better validation. It’s ideal on daily and weekly charts. Day traders usually look for shorter versions in smaller timeframes.
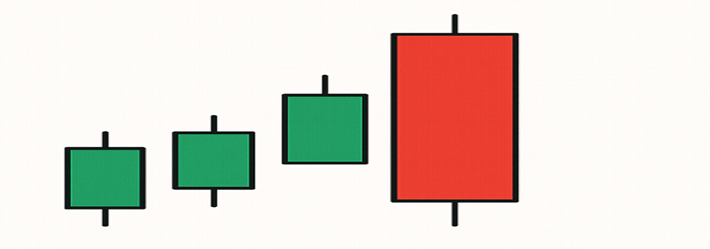
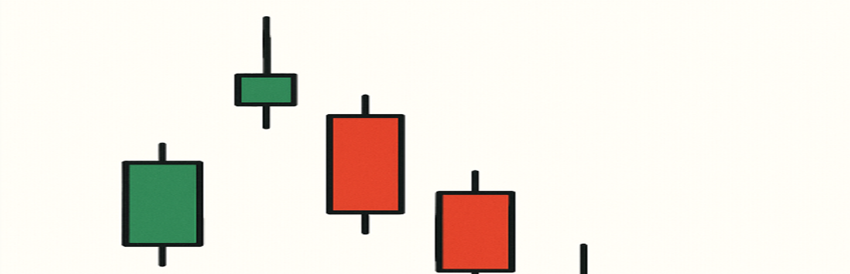
- Three Black Crows
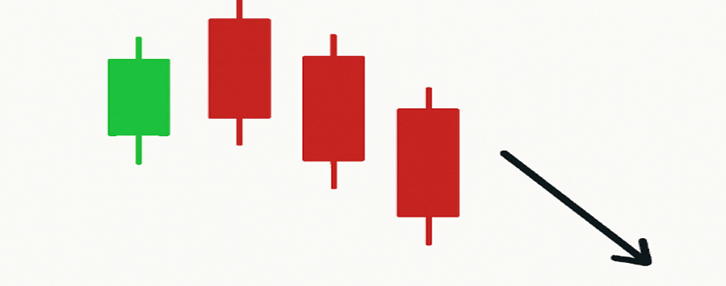
Three Black Crows form when the market flips from bullish to bearish. This pattern has three consecutive red candles. Each candle opens within the body of the previous one and closes lower. It shows steady selling pressure without major intraday recoveries. Traders use this as a sign that bears have taken control. You’ll often spot it at the top of an uptrend or after a failed breakout. High volume during the pattern strengthens its reliability. It’s effective on daily and higher timeframes. Combine it with RSI or moving average crossovers to confirm trend reversal. Avoid trading this in oversold conditions—it works best in neutral zones.
- Dark Cloud Cover
This is a bearish reversal pattern that shows up after a price rally. The first candle is a big green one, followed by a red candle that opens higher but closes deep into the first candle’s body—at least halfway. That visual shift shows strong seller aggression. It signals that bulls have lost momentum. Traders use this to exit long trades or open short positions. It becomes highly reliable when supported by high volume and resistance levels. Always wait for the next candle to close below the pattern for confirmation. Daily and 4-hour charts show this pattern best. It’s common before strong downtrends.
Wrapping Up
Candlestick patterns are at the heart of technical analysis. It doesn’t matter whether you are trading cryptos, stocks, or commodities; these candlestick patterns are useful in all conditions. That’s the reason almost every technical analyst and trader swears by them!
The only problem? They cannot work on their own. Traders have to use multiple other tools to confirm the entry or exit. That’s why a complete understanding of technical analysis matters. And the best place is to start with candlesticks!
We hope this blog has offered you great insight into the most popular candlestick patterns. Follow us on LinkedIn for more such informative stuff. Till then, safe and sound trading to all!