Top 5 Tools for Technical Analysis in Crypto
In crypto, timing matters. These tools help traders read the market with clarity and act without hesitation.
If you are into crypto trading (or any other trading), you must heard about the term Technical Analysis (TA). In fact, some of you might even have used it up to a certain extent. But the field itself is so vast and complex that traders (especially beginners) often get confused about where to start and what tools to use.
So, in this blog, we will learn the basics of Technical Analysis and the top 5 technical analysis tools professionals use to improve their win ratio. Let’s begin.
What is Technical Analysis in crypto?
Technical Analysis is a method of predicting a crypto’s price using historical market data. Generally, this data includes price and volume. Technical Analysis in crypto can be used to identify trends, momentum shifts, and possible reversal zones. Cryptos are highly volatile and can witness double-digit fluctuations in a single day. That’s where technical Analysis in crypto can help traders make the right decision based on data.
The project’s technology, roadmap, or team plays no role when you are doing Technical Analysis in Crypto. It’s purely dependent on what’s on the chart. It relies on price action, volume, and chart patterns. Professionals build a systematic approach to identify good entry and exit points using Technical Analysis in crypto.
Now, let’s take a look at the top 5 Technical Analysis tools for crypto trading.
What are the Top 5 Technical Analysis Tools in Crypto Trading?
Candlestick Patterns
Candlestick patterns represent price movements within a specific timeframe—1 minute, 1 hour, 1 day, and so on. Each candle shows four key values: open, high, low, and close. The body and wicks (or shadows) provide insight into market pressure from buyers and sellers during that period.
Candlestick formations help traders understand short-term sentiment. A single candle can signal indecision or aggression. A group of candles often hints at continuation or reversal.
How It Works
Each candle forms based on price activity within its timeframe. When combined into sequences, they form recognizable patterns that repeat across all crypto markets. Patterns signal areas where bulls or bears temporarily dominate.
Some patterns suggest potential reversals, while others point toward continuation. When these patterns appear at strong support or resistance zones, they gain even more significance.
Example
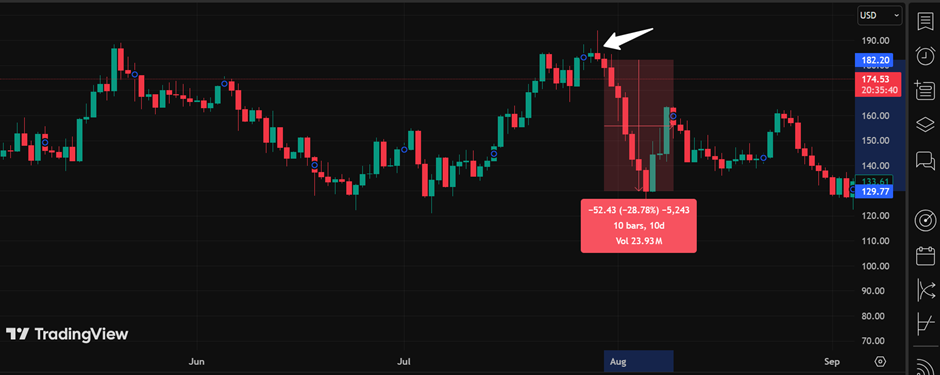
Below is an excellent example of how candlestick patterns work. As you can see, on 30th July, SOL made a Shooting Start candle stick pattern. In previous sessions, it had formed a Doji too. This was a clear indication of a bearish sentiment. After 20th July, SOL crashed almost 30% within 10 trading sessions.
Moving Averages (MA)
Moving averages are one of the most popular tools for Technical Analysis in cryptos. Moving averages give smoothened price data over a specific period. This can help identify the price trend of any crypto.
As the name suggests, they represent an average price movement over a specific period. You can use them as dynamic trendlines that adjust with the actual price movement!
The two most popular moving average types are:
- Simple Moving Average (SMA): Average price over a set number of periods.
- Exponential Moving Average (EMA): Gives more weight to recent price action for faster response.
How Does It Work?
Traders plot moving averages on their charts. The most common moving averages are 50, 100, or 200-period lines. If the price stays above the plotted moving average, the trend is generally considered to be bullish. If it’s below the moving average, the trend might be bearish.
Moving averages also act as dynamic support or resistance levels. Price often reacts near them—either bouncing off or breaking through.
Traders also watch crossovers. When a shorter-period MA crosses above a longer one, it’s called a bullish crossover. The opposite is bearish.
Example
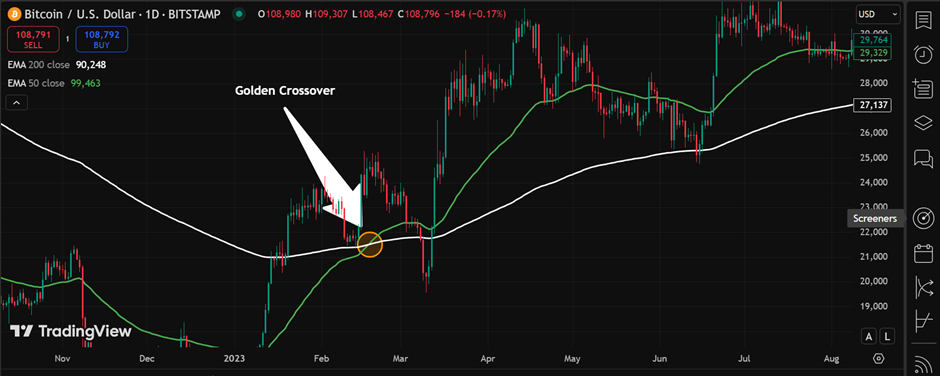
The best example of EMA crossover is visible below. This happened on 18th February 2023 in Bitcoin. This was the day when the 50-day EMA (green line) crossed the 200-day EMA (white line). This is known as a Golden Crossover. Once this happened, BTC’s price shot up more than 25% in the short term. After that, the 50-day EMA never decisively broke the 200-day EMA till today. It keeps bouncing off from the 200-day EMA level.
Relative Strength Index (RSI)
RSI is a momentum oscillator. It’s used to measure the speed and change of price movement. It’s plotted on a scale from 0 to 100. Let’s say if a crypto’s RSI is above 70, it means it’s in an overbought zone. So it might be possible that you are looking at possible sell-off or profit booking in the short term.
Similarly, if the RSI is below 30, it means the crypto is in an oversold zone. So it’s possible that the price might reverse due to demand. Measures the speed and change of price movements. It’s plotted on a scale from 0 to 100.
Professionals use these levels in conjunction with other tools to identify potential reversals on both sides.
How It Works
RSI doesn’t track price direction—it tracks the strength of recent price moves. Traders use it to evaluate if a trend still has energy or if it’s weakening.
Divergence is one of RSI’s strongest signals. If the price forms new highs but the RSI fails to follow, it suggests the momentum behind the move is fading. The same applies in reverse.
Example
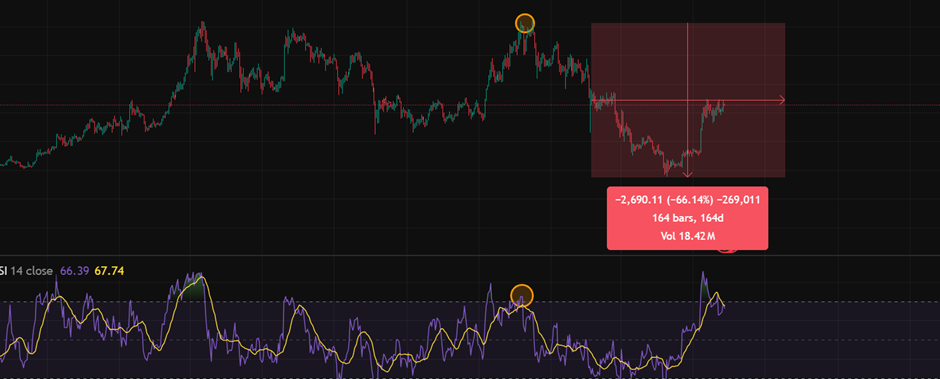
On 7th December 2024, the RSI of ETH was at 73. Ethereum was near its all-time high (ATH) on that day. But as the RSI was at 73, ETH was in an overbought region. From there, ETH cracked almost 65%! This is just one example, and that too, without divergence. You can find numerous more such examples while analyzing charts.
Fibonacci Retracement
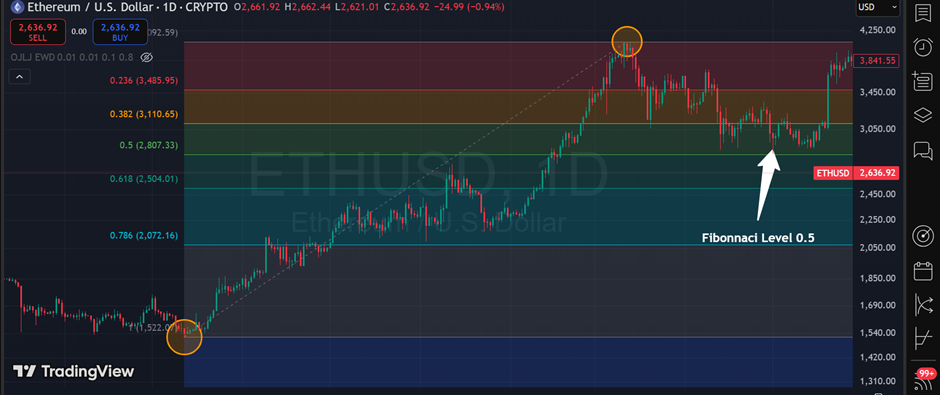
Fibonacci retracement is another powerful tool that traders use to identify potential supports and resistance. The tool is based on the famous Fibonacci sequence. The most important ratios, like 0.382, 0.5, and 0.618, are generally regarded as reaction zones. When prices come near these zones, they tend to reverse in many cases.
So traders draw Fibonacci retracement levels between a high and a low. Once done, this helps them project where the next bounce or rejection might occur.
How It Works
Once a trend is established, the price rarely moves in a straight line. Instead, it pulls back before resuming the move. Fibonacci levels divide this pullback into ratios. These zones become potential buy areas in an uptrend or sell areas in a downtrend.
The 0.618 and 0.5 levels are often called the “golden pocket .”Reason? This is the zone where traders expect a strong reaction. Institutional traders commonly position themselves around this zone.
Example
On 12th March 2024, ETH touched its all-time high of $4092. As you can see, if you draw a Fibonacci retracement from its previous swing low of $1522 on 12th October 2023, you will find 0.5 and 0.618 Fibonacci levels at $2807.33 and $2504.01, respectively. The price bounced back exactly from $2815 on 01st May 2024!
Volume Profile
What It Is
Volume Profile is a charting tool that shows how much trading occurred at each price level rather than over time. It visualizes where traders placed the most buying or selling interest in the recent price range.
Unlike standard volume bars, which sit at the bottom of the chart, Volume Profile plots activity horizontally along price points.
How It Works
Volume Profile helps traders identify key zones:
- High Volume Nodes (HVN): Areas where price spent time and volume accumulated. These act as strong support or resistance.
- Low Volume Nodes (LVN): Thinly traded zones where price often moves quickly through.
When price approaches a high-volume area, it tends to stall or reverse. When it enters a low-volume pocket, it tends to accelerate until it hits the next HVN.
Example
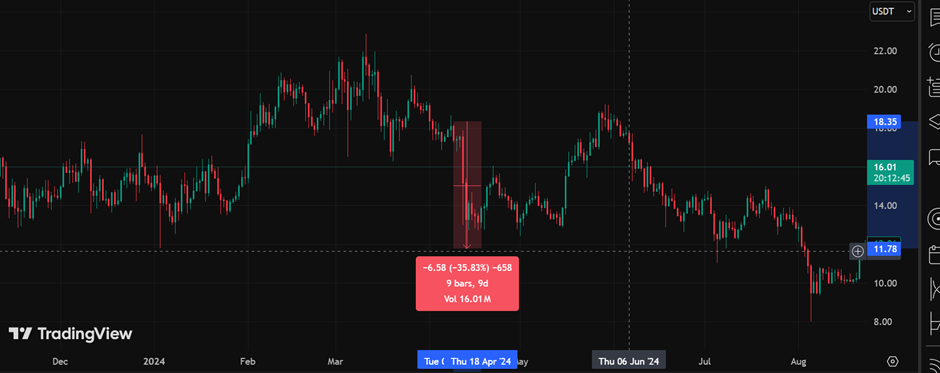
Between February and March 2024, Chainlink’s price found strong resistance around the $18 level, a high-volume node identified by the Volume Profile. This level had previously acted as resistance, and upon reversing from there, the price dropped quickly.
Now that you know about the top 5 technical analysis tools, it’s time to analyze the limitations of technical Analysis in crypto.
Limitations of Technical Analysis
Look, Technical Analysis is not a holy grail. It’s a great method, but it cannot predict accurate price movement every time. They do have some limitations, and here are they:
- Lagging indicators often react after the price has moved
- It ignores fundamental factors
- False signals are common in low-liquidity coins
- It relies heavily on historical data
- Different traders interpret the same chart differently
- It struggles during sideways or choppy markets
- It requires constant monitoring and discipline
Top traders know these limitations of technical Analysis in crypto. So they practice a lot, use reliable platforms like Visiion.io, and keep learning to get an edge.
Wrapping Up
Technical Analysis gives traders a structured way to interpret market behavior. It transforms raw price data into actionable signals. The tools that we mentioned in this blog offer a unique layer of information about crypto. You can use them collectively based on your risk appetite and trade setup.
Remember, no single tool holds all the answers. The key lies in combining them.
Here’s an example of how professional traders combine these tools:
- They use candlestick patterns to read immediate price sentiment.
- Then, they confirm the trend with moving averages.
- Once done, they check momentum with RSI.
- Then, they used Fibonacci levels to identify reaction zones.
- Finally, they validate areas of interest with Volume Profile.
These tools are widely used because they help traders act on patterns that repeat across timeframes and tokens. They work best when traders use them consistently and combine them with solid risk management.
The crypto market moves fast. These tools help traders read the momentum, understand pressure points, and step in or out with a clear mind.
Note: Information shared in this blog is for information purposes only. Visiion.io does not recommend any crypto asset mentioned in the above blog for trading and investing. Crypto markets are rewarding but highly volatile. Please consult your financial advisor before investing in crypto.